The housing market is incredibly slow. And it has crashed. But not in the way most people envision a crash.
When most people hear "crash" they think prices are falling fast and hark back to the days of 2008 through 2012 when the Case-Shiller National Home Price Index dropped 27% from peak to trough. So when you see the headline "the housing market slowdown is much worse," you may think tons of homeowners can't sell their homes, foreclosures are piling up, and prices are crashing.
Just open up YouTube or TikTok or Instagram and you can easily find tons of doom telling you the market has never been worse. You can't invest in real estate. The pigeons are coming home to roost. The baby boomers are ruining the housing market. There's no hope to ever buy a home. And if you do buy a home, you are foolish.
Much to their chagrin, however, the real crash is not in prices. The real crash is in transactions.
Existing home sales totaled just 4.06 million in 2025 — the lowest level since 1995 and essentially unchanged from 2024, according to the National Association of Realtors. The pre-pandemic norm was around 5.2 million. That's roughly one million fewer home sales per year despite having 6 million more jobs than in 2019. February 2026 came in at a 4.09 million annualized rate. The market isn't crashing in price. It's crashing in activity. Nobody is buying. And nobody is selling.
I live inside the data. I look at the weekly housing data from Redfin's data center every single week on my live stream, and what I'm finding is truly unbelievable.
For the last two years, the story has been how inventory would explode and crash prices. See, you need inventory — lots of it — and you need it quickly in order for prices to fall. All you have to do is look at an area like Austin, Texas. Inventory piled up. Tons of new construction. And consequently, prices have fallen. That's the recipe for a price crash.
But the recipe for our current slowdown is not more inventory. Instead, we've seen higher interest rates for longer, combined with record amounts of homeowner equity and low distress. Combine that with a job market that's strong compared to historical standards, and you're left with a locked, frozen market where sellers refuse to transact. I wrote about this same dynamic in Ohio back in February — the strain is real, but it's not a crash.
Jacksonville FL Tells the Whole Story
There may be no better way to visualize this than looking at Jacksonville, Florida. (Watch me break this down live)
You've got low demand. Crashing supply. Crashing transactions. And guess what? Prices are actually up 2.8%. Confused yet? A lot of people are.
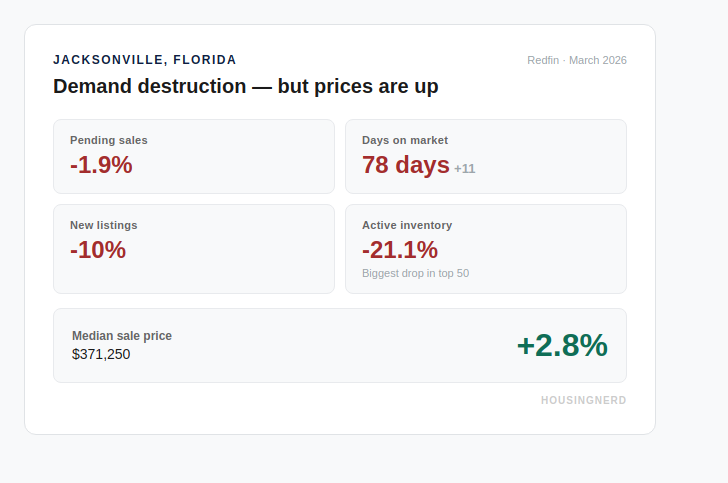
Here's what the Redfin weekly data shows for Jacksonville right now:
- Pending sales: down 1.9% year over year
- Days on market: 78 days — up 11 days from last year
- New listings: down 10%
- Active inventory: down 21.1% — the biggest inventory drop of any major metro in the country
- Median sale price: $371,250 — up 2.8%
Fewer people buying. Homes sitting longer. Fewer sellers listing. And 21% fewer homes available. Yet prices are going up. (See the Jacksonville inventory data)
That's not a crash. That's a freeze.
Demand Is Dead — 27 of 50 Metros Have Fewer Buyers
The demand destruction is real and it's widespread. Nationally, pending sales are down. In 27 of the top 50 metros, there are fewer buyers than last year. (National stats breakdown)
Some of the worst:
- New York: pending sales down 15.1%
- Houston: pending sales down 14.4%
- Lakeland FL: down 14.9%
- Seattle: down 11.3%
- Orlando: down 11.6%
- Tampa: down 9.5%
And it's not hard to figure out why. Mortgage rates spiked from 5.99% to 6.55% in a single month — thanks to the Iran conflict, rising oil prices, and inflation that refuses to come down. If you think inflation is coming down, you're dreaming. Everything costs more. Gas, groceries, insurance, utilities. Buyers look at the monthly payment and say "not right now."
Houston — The Doom City
If there's one market where the doom story is playing out across every metric at once, it's Houston. (Watch me break down Houston)
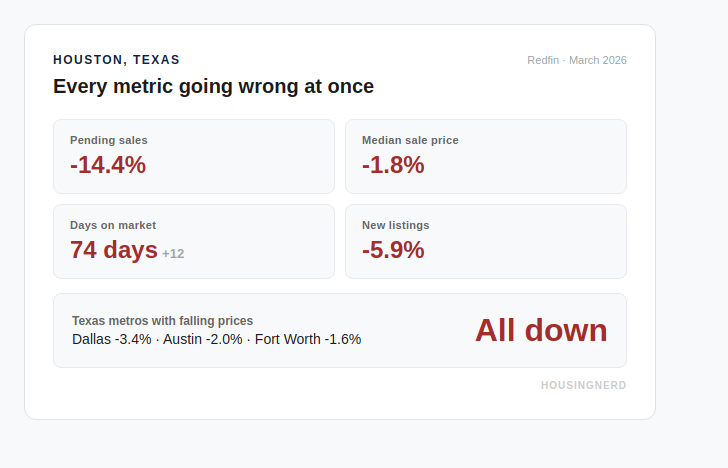
- Pending sales: down 14.4%
- Prices: down 1.8%
- Days on market: 74 days, up 12 from last year
- New listings: down 5.9%
Everything is going wrong at once. In fact, every single Texas metro has falling prices right now. Dallas down 3.4%. Austin down 2.0%. Houston down 1.8%. Fort Worth down 1.6%.
44 of 50 Metros — Homes Sitting Longer
Here's the deal. In 44 of the top 50 metros, homes are taking longer to sell than they did last year. Average increase: 6.5 days.
Some of the worst:
- Myrtle Beach SC: 123 days — that's four months to sell a house
- San Antonio TX: 104 days, up 17.5 days from last year
- Miami FL: 97 days
- Nashville TN: 90 days, up 20 days
- Austin TX: 87 days, up 12 days
And the biggest price drop in the top 50? Naples, Florida — down 8.8% year over year.
The Flood That Never Came
Now here's the thing. Everyone said 2026 was going to be the year the flood of listings finally hit. Sellers were supposed to crack. Inventory was supposed to surge. The crash was finally coming.
It never happened.
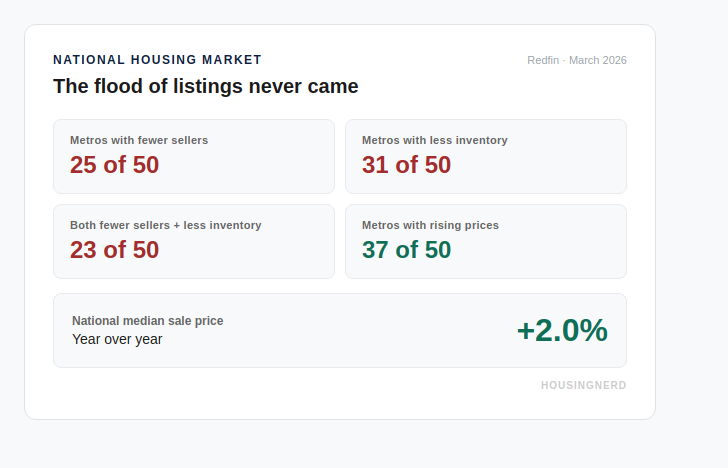
Fewer Sellers — 25 of 50 Metros
In 25 of the top 50 metros, there are fewer people listing their homes than last year. The median across all 50 metros is actually negative.
- Naples: new listings down 23.9%
- Tampa: down 15.7%
- North Port: down 14.1%
- Miami: down 11.2%
- Jacksonville: down 10%
- Houston: down 5.9%
- New York: down 4.9%
These sellers are locked into 3% mortgage rates. They're not distressed. They don't need to sell. So they're not selling.
Less Inventory — 31 of 50 Metros
In 31 of the top 50 metros, there are fewer homes on the market than last year. Average: down 1.6%.
- Jacksonville: down 21.1% — biggest drop in the top 50
- Cape Coral FL: down 19.5%
- Deltona FL: down 19.4%
- Naples FL: down 19.1%
- Lakeland FL: down 18.7%
- Tampa FL: down 10.4%
Florida. The state everyone said was going to crash. Inventory is falling in almost every Florida market.
23 of 50 — The Total Freeze
And in 23 of the top 50 metros, BOTH new listings AND active inventory are falling at the same time. No new sellers showing up. What's already on the market is shrinking. There is no flood. There is no wave of distressed sellers. It's not coming.
Tampa — The City Every Doom Channel Said Was Crashing
Tampa has been all over doom YouTube for two years now. Everyone said it was done. (Watch me break down Tampa)
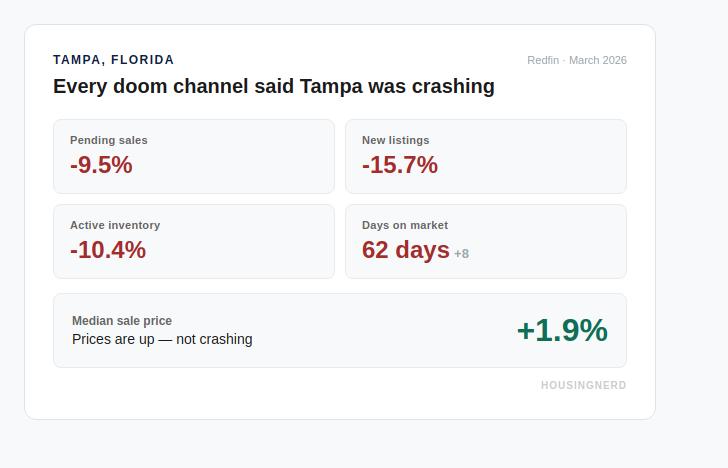
- Pending sales: down 9.5%
- New listings: down 15.7%
- Active inventory: down 10.4%
- Prices: up 1.9%
The city every doom channel told you was crashing. Prices are up.
So Why Are Prices Still Going Up?
If demand is dead, if homes are sitting longer, if the market is this slow — why haven't prices crashed? (Watch me explain this)
Because 37 of 50 metros still have rising prices. The national median sale price is up 2% year over year. Not down. Up.
- Cincinnati: +8.7%
- Baltimore: +6.9%
- Pittsburgh: +6.6%
- Philadelphia: +5.8%
- Columbus OH: +4.3%
- Chicago: +4.3%
- New York: +4.3%
Seattle — The Brain Breaker
Want your brain to break? Look at Seattle. (Watch me break down Seattle)
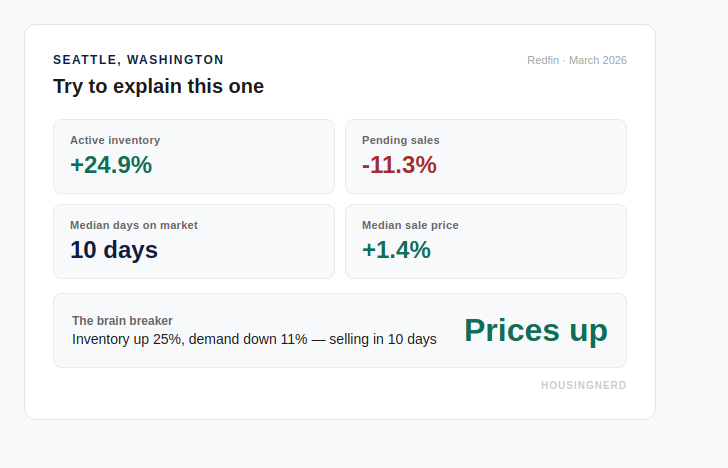
- Active inventory: up 24.9%
- Pending sales: down 11.3%
- Median days on market: 10 days
- Prices: up 1.4%
Inventory up 25%. Demand down 11%. And homes are selling in 10 days with rising prices. Explain that.
Columbus OH — No Crash in Sight
And right here in Columbus, Ohio — my market. (Watch me break down Columbus)
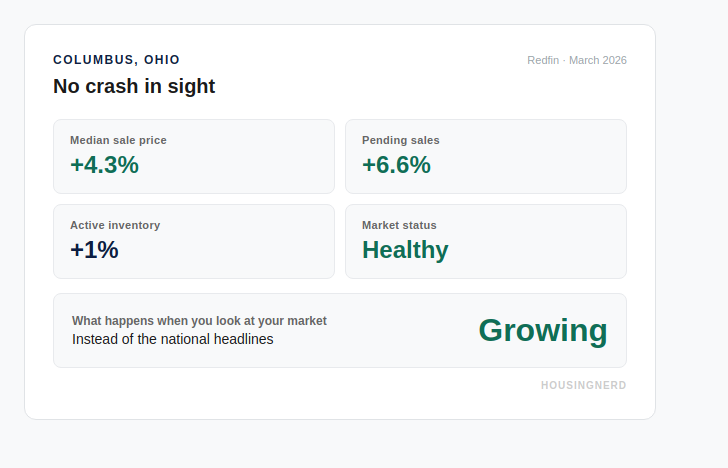
- Prices: up 4.3%
- Pending sales: up 6.6%
- Active inventory: up just 1%
No crash in sight. This is what happens when you look at your market instead of the national headlines. I break down the Ohio market every week on Ohio Housing Nerd — if you're in Central Ohio, that's where your local data lives.
New Jersey — Where Supply Has Vanished
And then you look at an area like New Jersey. I looked at Morris County on my live stream — 11 houses on the market. Eleven. Normally you'd say that's a market that never has inventory. Wrong. In 2019 they had 83 homes for sale. In 2020 they had 65. Now? Eleven.
When you zoom out and look at the entire state of New Jersey by zip code, virtually everything is brown on the map — meaning fewer homes for sale versus 2019. Some zip codes have 60, 70, 80% fewer homes than just six years ago.
Logic dictates that if you have nothing to sell — no supply — and even a hint of demand, your prices are going to continue to go up. And that's exactly what's happening. Prices in most of New Jersey are up. Some zip codes up 6, 8, 9% year over year. Record high prices in Morris County at $700,000. Where is this flood of distress selling everyone keeps talking about? Not in the Northeast.
Dallas TX — Where the Recipe Actually Exists
But that's not to say there aren't areas where prices have declined — even crashed depending on your definition. Look at Dallas, Texas.
Dallas has 23,220 listings right now — a decade-high level of inventory. Days on market are at 57, nearly tied for a decade high. Pending sales are barely up at 1.3%. And prices are down 4% year over year. Since the 2022 peak, Dallas home values have dropped 7%.
That's the recipe for falling prices. Tons of inventory. Tons of new construction. And not enough buyers. If you bought at the peak in 2022 in Dallas, your home is probably worth less today.
But here's what most people miss — all of that growth happened in just two years, from 2020 to 2022. Since 2020, Dallas is still up 37%. The "crash" gave back some of the COVID gains. It didn't wipe out the market.
The Crash Needs a Supply Flood — And There Is No Supply Flood
So where does that leave us? The housing market has crashed — just not the way most people expected. Transactions are at 30-year lows. Buyers can't afford to buy. Sellers won't sell. The market is frozen.
But the price crash that everyone keeps waiting for needs one ingredient that doesn't exist right now — a flood of inventory from distressed sellers. And when I look at Jacksonville with inventory down 21%, Tampa with new listings down 16%, and 23 of the top 50 metros with both fewer sellers AND less inventory than last year, I'm not seeing that flood. I'm looking for it. I'm trying to find it. I don't see it.
Until something forces sellers to sell — massive job loss, a financial crisis, some event that triggers panic — prices are going to stay right where they are. Or keep going up. The proof is in the numbers. If you want to see what this looks like at the county level in Ohio, I did a full 88-county breakdown in my March 2026 Ohio market analysis.
Should You Buy Right Now?
The market will always have uncertainty. There will always be a reason to wait and always a reason to move. What I've seen over and over again is that the buyers who do well aren't the ones who timed it perfectly — they're the ones who prepared, knew their numbers, and made a decision grounded in their own life.
If you're wondering whether now is the right time for you, I built a free guide that walks you through it. Five honest questions. Ten minutes. No fluff. You'll know exactly where you stand — based on your situation, not the headlines.
Download the Free Buyer Guide
Five honest questions. Ten minutes. No fluff.
- Why do you actually want to buy — is it your reason or someone else's?
- Do you have a clear picture of what you can truly afford?
- Do you have your down payment, closing costs, 6 months reserves, and moving costs covered?
- Is your income stable and can you commit to the area for at least 5 years?
- Do you know what's actually happening in your specific local market?
Five yes answers — your foundation is strong. Three or more no answers — more preparation will serve you well. That's not failure. That's financial discipline.
I go live every week breaking down the latest housing market data. Subscribe to Housing Nerd on YouTube for national analysis or Ohio Housing Nerd for Central Ohio data. If you're buying or selling in Central Ohio and want to talk through what the numbers mean for your situation, reach out anytime.