November 2024 Central Ohio Housing Update: Prices High as Supply Remains Depleted
Home prices in Central Ohio have demonstrated remarkable resilience in 2024, primarily attributed to low inventory levels and the ongoing lock-in effect for current homeowners. This phenomenon has created a unique market landscape that both buyers and sellers need to understand.
Many homeowners in Central Ohio, who purchased their properties several years ago, are currently enjoying the benefits of low mortgage rates coupled with historically lower purchase prices. This advantageous situation has caused these homeowners to feel “locked in” to their existing low monthly payments. Consequently, they are often reluctant to move up or invest in other homes, which has a significant impact on the overall housing market. This reluctance translates to fewer new listings entering the market. In fact, the number of new listings fell by 3.8% year-over-year for November, showing a consistent trend. Even year-to-date figures reveal only a modest 7.4% increase compared to 2023, indicating a continued scarcity in available homes.
While it's true that the overall number of homes for sale has increased by 18% year-over-year for November, the year-to-date increase is a more modest 7.2%. This illustrates the uneven nature of the market and highlights the ongoing challenges facing potential buyers. Meanwhile, buyer demand has only increased slightly, with a 0.4% rise for November and a 3.1% increase year-to-date. These figures suggest that while there is some interest from buyers, it is not enough to cause a significant uptick in sales or property turnover.
The steady demand combined with a consistent lack of new listings is contributing to a sustained increase in home prices. As of November, the median sales price stands at $319,000, marking a notable 6.4% increase year-over-year. Earlier in the year, in June, the median sales price peaked at an all-time high of $335,000, up from $298,000 at the beginning of the year. This upward trend follows the typical seasonal patterns observed in real estate markets but also highlights that home prices have not softened compared to the previous year.
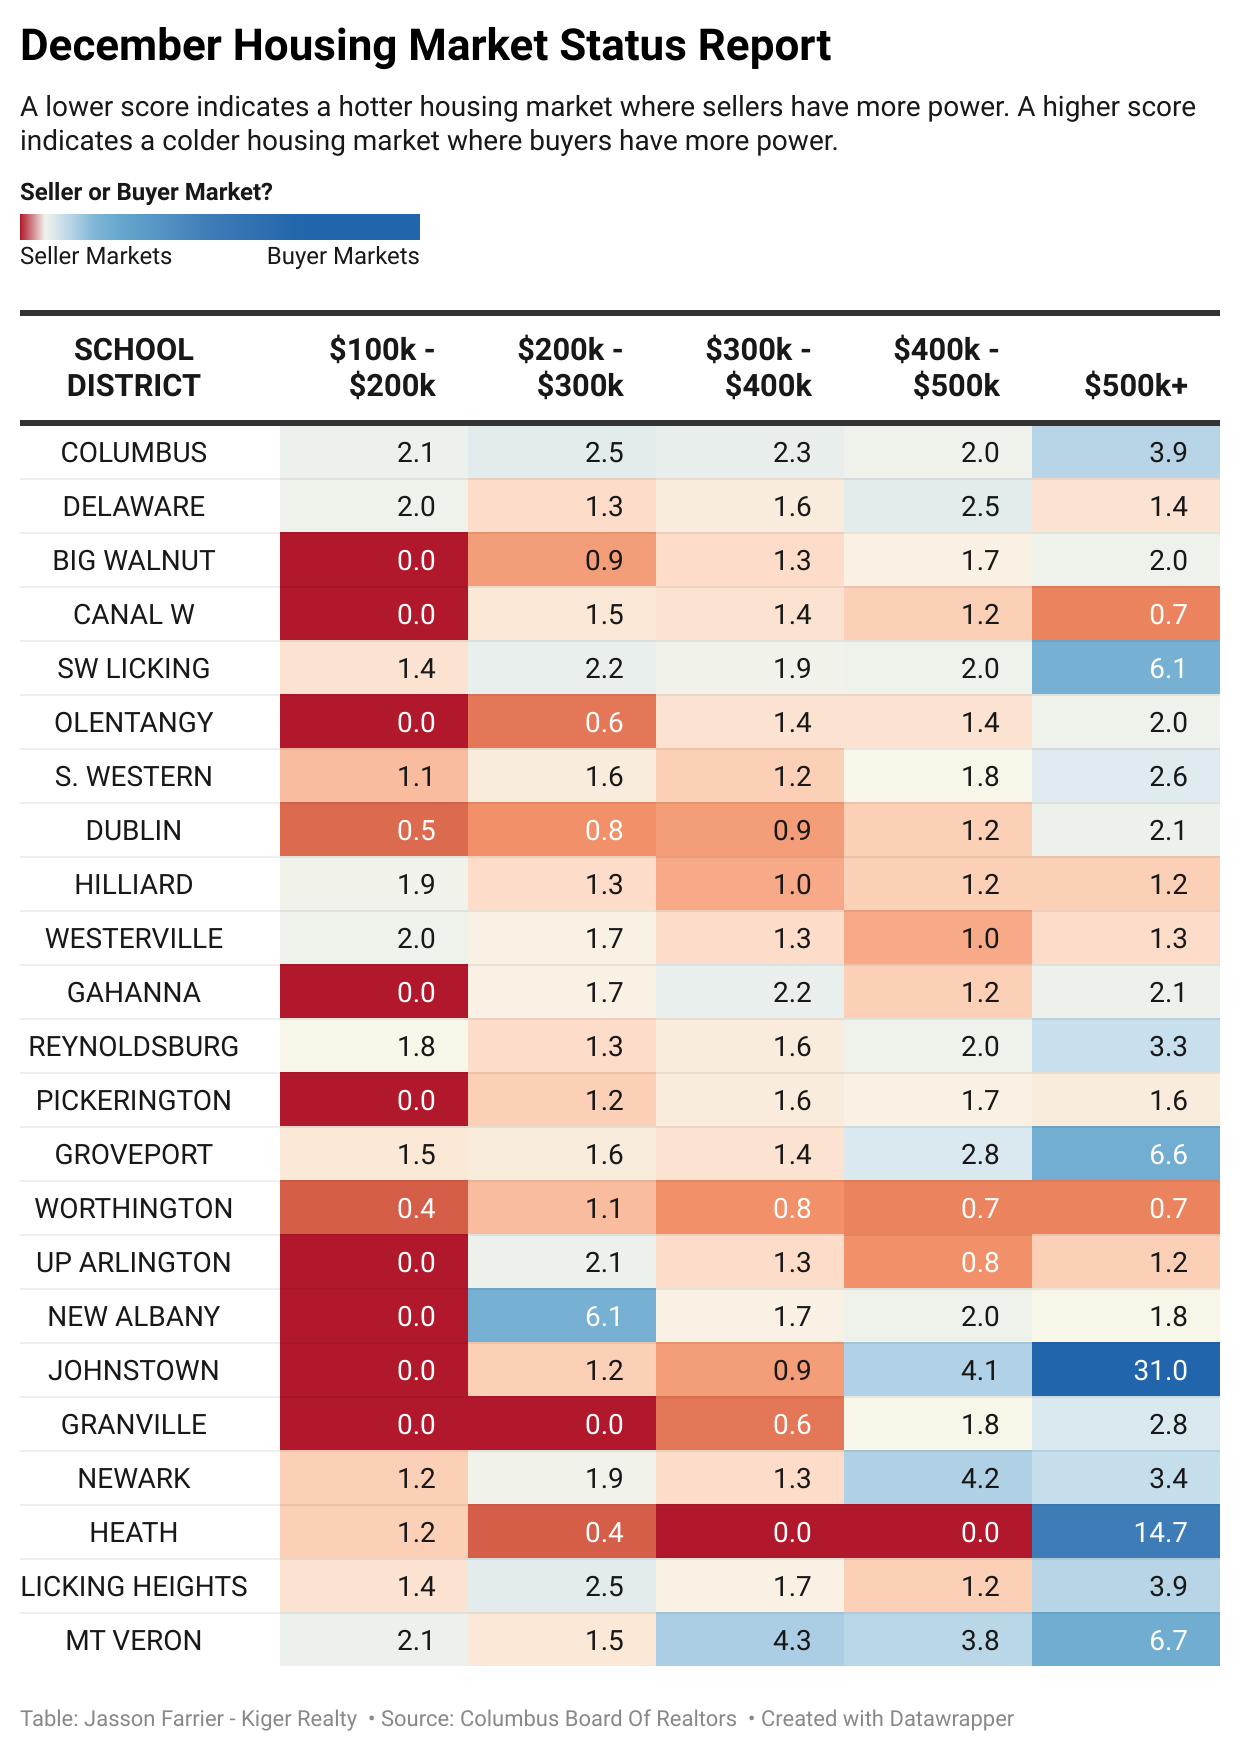
Another important metric to consider is the overall absorption rate, which indicates supply versus demand in the market. In November, this rate fell to 2.09 months, demonstrating that supply lags behind buyer demand. This situation confirms that Central Ohio is predominantly a seller’s market, where sellers have a distinct advantage. However, certain pockets are beginning to display characteristics of a buyer's market, particularly in higher price brackets. For instance, homes priced over $500,000 typically show a larger supply and may offer better deals for discerning buyers. In the Southwest Licking School District, homes in this price range have a supply of six months, suggesting that buyers here may have more options. Similarly, Groveport Schools report a slightly higher 6.6 months supply for homes over $500,000. In contrast, Johnstown—home to the new Intel Gigafactory—displays a significant supply issue with 31 months of inventory available at the same price point. Other districts, such as Heath City Schools and Mount Vernon, also indicate a buyer’s market, with 14.7 and 6.7 months of supply for homes exceeding $500,000, respectively. On the other hand, the New Albany area, which is also close to the Intel Gigafactory, presents intriguing opportunities for potential buyers looking for lower-priced homes. There are several condos and housing options available in the $200,000 to $300,000 price range, making it an attractive option for first-time homeowners or those looking to downsize.
It’s crucial to keep in mind that every housing market is different, and real estate is inherently hyper-local. Factors such as school districts, neighborhood dynamics, and local amenities all play significant roles in determining market trends. Buyers and sellers should be astute in their approach and well-informed about their specific markets. If you’re looking to navigate the complexities of your local real estate landscape, feel free to reach out for a personalized, free analysis of your particular school district, neighborhood, or subdivision. Having a clearer understanding of the market can help you make informed decisions, whether you are buying or selling property.
In assessing the current market status, our focus lies on the absorption rate, also known as months of supply. This key metric is derived by dividing the available inventory by the number of closed sales for a time period.
Market Categorization:
Strong Sellers Market: An absorption rate below 2 indicates a strong seller’s market.
Sellers Market: Having 2 to 4 months of supply falls under a seller’s market category.
Balanced Market: Falling within the 4 to 5 months of supply range signifies a balanced market.
Buyers Market: A market with 5 to 7 months of supply is classified as a buyers market.
Strong Buyers Market: The scenario where there are 7 months or more of supply represents a strong buyers market.
Segmentation for Analysis: To provide a comprehensive market status report, the absorption rate breakdown is conducted based on price categories and school districts. This approach allows for a detailed understanding of the dynamics within different segments of the real estate market in our area.
By regularly monitoring and dissecting the absorption rates across various segments, we are equipped to offer informed insights and guidance to both buyers and sellers navigating the ever-evolving real estate landscape. Regardless of the chart results it is important to consult with a realtor and do your own research when buying or selling real estate. Markets move fast and it's important to check the latest inventory figures and comparable sales.
All data referenced from the Columbus Board of Realtors