Ohio housing affordability just took the biggest hit of any state in America. In 2020, two out of three jobs in Ohio paid enough to afford a typical home. By 2025, it was one in four.
That's not my opinion. It's from a new national study by the National Housing Conference, and I broke it down on my latest Ohio live stream. My own data backs it up. The typical Ohio mortgage payment — with taxes and insurance — went from $827 a month in 2020 to about $1,700 today. More than double. In six years.
If you've tried to buy a house in Ohio lately, you already felt this. Before COVID, it was a completely different market. In this post I'll show you why Ohio fell the farthest, how much payments really went up, why prices still aren't crashing, and how to look up the payment in your own ZIP code.
- Ohio had the largest drop in homeownership affordability of any state from 2020 to 2025, according to the National Housing Conference.
- The share of Ohio jobs that can afford a typical home fell from 67% to 26% — a 41-point drop.
- Ohio is not the least affordable state. It's still above the national 14%. It just fell the fastest.
- The typical Ohio monthly payment more than doubled, from $827 in 2020 to about $1,700 today. More than half of Ohio's larger ZIP codes have seen their payment at least double.
- Prices aren't crashing because nobody has to sell. Ohio is still listing about 2,000 fewer homes a month than in 2020.
Why Did Ohio Rank Worst for Housing Affordability?
Ohio ranked worst because it lost more affordability than any other state from 2020 to 2025. In 2020, 67% of Ohio occupations could afford a typically priced home. By 2025, just 26% could. Home prices, mortgage rates, taxes and insurance all rose much faster than Ohio paychecks.
Source: National Housing Conference press release, October 12, 2026.
The National Housing Conference looked at nearly 300 occupations across 390 metro areas. For each one, they asked a simple question: can a person working this job afford the typical home where they live? Then they compared 2020 to 2025.
Ohio lost 40.97 percentage points. That's the largest loss in their entire national dataset. And here's the part that should bother you — this isn't just a pandemic hangover. Since 2023, Ohio dropped another 5 points. Only Illinois (10.86) and Maryland (7.10) fell more over that stretch.
It gets worse at the city level. Five of the 25 metros with the biggest affordability losses in the country are in Ohio:
- Mansfield — #2 in the nation
- Cleveland — #8
- Springfield — #10
- Toledo — #13
- Akron — #23
The only metro in America that fared worse than Mansfield was Syracuse, New York. You can read the full report here, or watch me walk through it live.
Ohio Isn't the Least Affordable State. It Just Fell the Fastest.
I want to be clear about this, because the headline gets twisted. Ohio is not the least affordable state in America. Not even close. Ohio's 26% is still well above the national number of 14%. California sits at 3%. Florida at 7%.
Source: National Housing Conference, Priced Out (October 2026)
What happened is that Ohio had the most to lose. Before COVID, Ohio was one of the most affordable places in the country to buy a home. A teacher, a firefighter, a mail carrier — they could buy a house here. That's what made Ohio, Ohio. Then prices exploded, rates doubled, and a huge number of jobs crossed the line at the same time.
There's another piece to this. One of my live viewers, E-Rock, said it well: a lot of people have moved into Ohio since COVID. He has two houses on his street that sold to buyers from Washington State. I'm seeing it all over the place too.
It's all about perspective. If you're used to paying $600,000 for a home and you move here and see one for $300,000, you're thinking, "That's a sale. I'll take two." Paying $325,000 instead of $300,000 doesn't faze you. But for the family that's lived here for 20 years on an Ohio paycheck, that's the difference between buying and renting forever. My 14-year-old son said it best: people want to live in Ohio. It's a great place. So obviously people are going to move here. (Watch that conversation)
How Much Has the Typical Ohio Mortgage Payment Gone Up?
Here's the typical home in Ohio, using 20% down, a 30-year fixed loan, local property taxes and homeowners insurance.
Typical Ohio home, 20% down, 30-year fixed, property tax + insurance · Source: Ohio Housing Data (Zillow, Census, Mortgage News Daily)
| July 2020 | Today | |
|---|---|---|
| Typical Ohio home value (Zillow) | $162,808 | $249,996 |
| 30-year mortgage rate | 3.02% | 7.24% |
| Principal & interest | $551 | $1,363 |
| Property tax + insurance | $277 | $346 |
| Total monthly payment | $827 | $1,709 |
That's an extra $880 a month to own the typical Ohio home. Over $10,000 a year. Same house. The biggest driver is the rate. In July 2020, the average 30-year mortgage rate was 3.02%, according to Freddie Mac. Today it's 7.24%, according to Mortgage News Daily. More than double.
And it's not just the statewide average. I pulled ZIP codes live on air, and the pattern repeats almost everywhere:
| Area | 2020 payment | Today | Change |
|---|---|---|---|
| Campbell (44405) | $300 | $807 | +169% |
| Centerburg (43011) | $1,122 | $2,632 | +135% |
| Lakeside (43440) | $1,130 | $2,566 | +127% |
| Trumbull County | $551 | $1,211 | +120% |
| Batavia (45103) | $1,141 | $2,320 | +103% |
| Brook Park (44142) | $784 | $1,574 | +100% |
| Dublin (43017) | $2,275 | $4,541 | +100% |
| Centerville (45458) | $1,797 | $3,351 | +86% |
Estimated monthly payment, 20% down, 2020 vs. today · Source: Ohio Housing Data
Cheap ZIP codes doubled. Expensive ZIP codes doubled. In Campbell, near Youngstown, the typical payment went from about $300 to $807 — and homes there are still only around $107,000. In Dublin, the same math takes you from $2,275 to $4,541 a month. Almost 5,000 bucks. Across Ohio, 288 of the 522 ZIP codes with at least 5,000 residents have seen their estimated payment at least double since 2020. You can look up the payment for your ZIP code here.
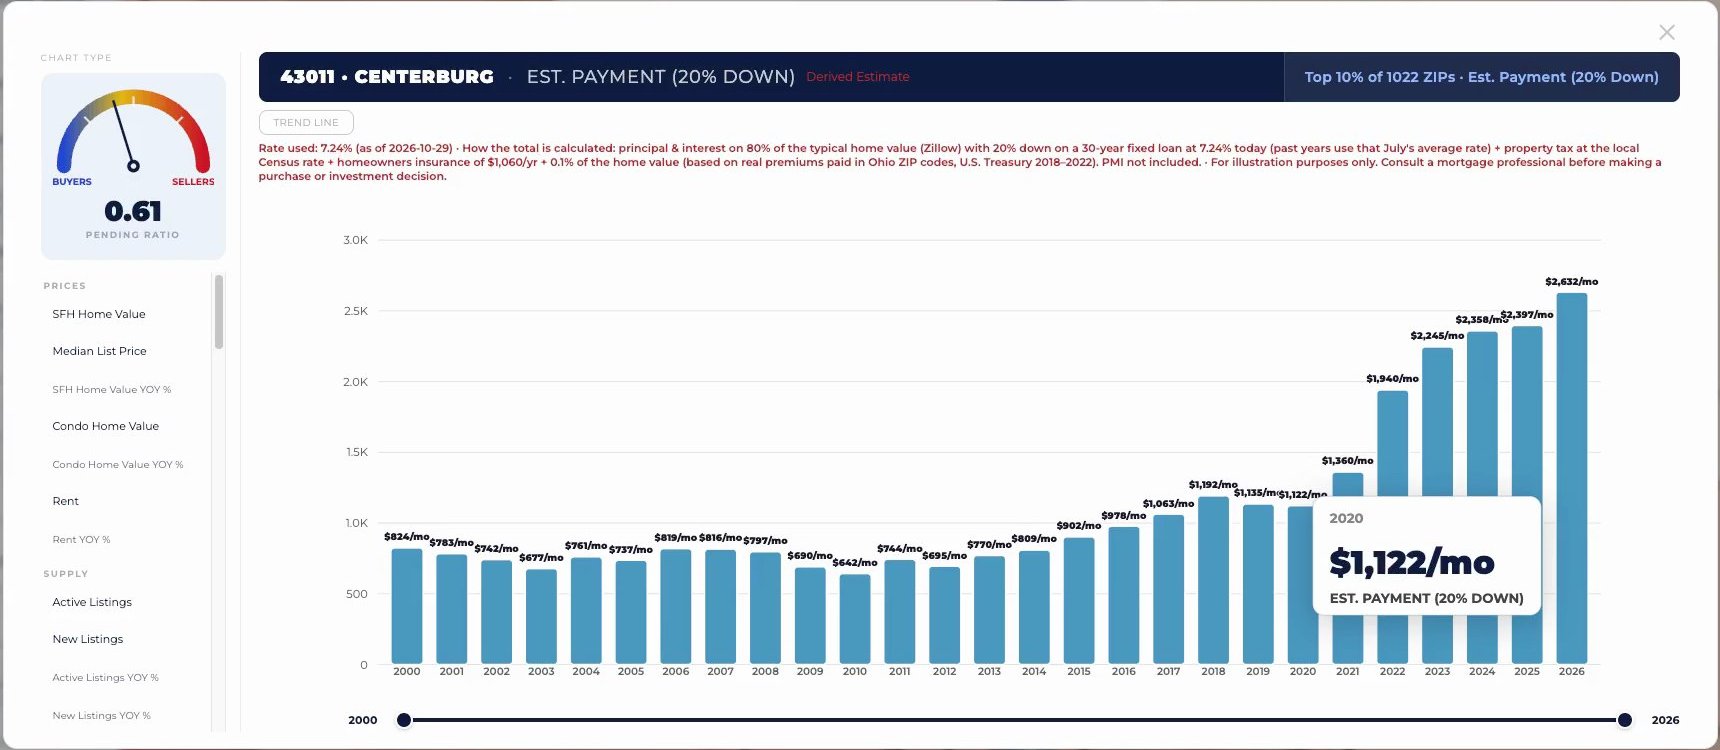
Every ZIP code on my Ohio housing data page has a payment chart like this one. Centerburg, Ohio: $1,122 a month in 2020, $2,632 today.
Look at the shape of that chart. For almost 20 years, the payment barely moved. In a lot of Ohio ZIP codes it actually went down from 2018 to 2020 as rates fell. Then 2020 to 2022 hit. In Centerville, the payment jumped 46% in just two years. In Batavia, 60%. Those two years wrecked the Ohio housing market. (See it live)
Now look at Trumbull County. The typical payment in 2020 was $551 a month. That's insane. That's less than a lot of car payments. And here's the thing — a lot of Ohio homeowners are still paying something close to that. Remember that, because it explains why prices aren't falling. More on that in a minute.
Today it's $1,211. That's up 120% since 2020. Did your paycheck go up 120%? Probably not. And that's the problem.
Why Ohio Paychecks Aren't Keeping Up
Mansfield tells the whole story. In 2020, 82% of the occupations tracked there could afford the typical home. That included elementary school teachers, special ed teachers, EMTs and paramedics, firefighters, and mail carriers. By 2025, just 30% of occupations could.
The typical Mansfield home cost $115,041 in 2020. By 2025 it was $188,863. The income needed to buy it went from $28,483 to $62,931 — a 121% increase.
Source: National Housing Conference, Priced Out (October 2026)
Now, I'll be honest. That $28,483 number doesn't compute in my head. I remember making 28 grand a year, and I don't see how I'd have afforded a $115,000 home. But the trend is the point. Housing costs went up 121%. The biggest raise any job got in Mansfield was teaching assistants at 81%. Industrial machinery mechanics got about 24%. Nobody's paycheck kept pace.
Columbus is no better. In 2020, 40% of jobs there could afford a typical home. In 2025, it was 9%.
And that's before you count the stuff that doesn't show up in the payment. Your water heater breaks. Your furnace goes out. Your roof starts leaking. As a homeowner, all of that is on you. If you're thinking about buying, I wrote about the five questions you should answer first.
Property Taxes and Insurance: The Costs on Top
One of my viewers, Kara, said property taxes are killing her payment as she looks at homes. Welcome to the party.
The median Ohio property tax bill went from $1,813 in 2020 to $2,231 in 2024, according to the U.S. Census Bureau. That's up 23% in four years. The Ohio Department of Taxation publishes the statewide numbers on how much property tax gets charged every year, and it keeps climbing. And it's worse in a lot of places. In Lakeside, the typical tax bill went from $1,900 to $2,800 a year — up 44%. That's 2024 data. It's probably higher today. Check the property tax trend for your area on my Ohio housing data page.
As an investor, I see this on every deal. Every deal I look at blows up because of taxes. It used to be you'd budget a few bucks a month for a tax increase. Not anymore. I plan for the worst. If I buy a building that hasn't been reassessed in 20 years, and the new value trickles through to the county auditor, my taxes explode. I could be underwater on day one.
You have to watch this as a homeowner too — especially on new construction. People get the tax estimate from the builder and think, "Look at this, my property taxes are nothing." Yeah. That's the tax on the dirt. Wait until the county actually values your house. Then they catch you up. Big difference in payment.
If you think your home is overvalued, protest it. Fewer than 5% of Ohioans ever do. It's free, you don't need a lawyer, and I walk you through it step by step in how to appeal your Ohio property tax value. I've also covered why Ohio is addicted to your property taxes and what happens when people fall behind — including how Ohio counties sell your tax lien to out-of-state investors.
Why Ohio Home Prices Keep Rising Instead of Crashing
If affordability is this bad, why aren't prices falling? I get this question every week. Ohio home prices are still sitting at or near record highs — you can see it in the monthly Ohio REALTORS® market data and on my Ohio housing data page.
Go back to that $551 Trumbull County payment. Who's leaving that payment? Nobody. Why would you? You can't rent anything for that. So people stay put. And when people stay put, they don't list their homes.
Source: Realtor.com via Ohio Housing Data
This September, about 13,500 Ohio homeowners listed a home for sale, according to Realtor.com data. In September 2020, it was 15,530. That's roughly 2,000 homes a month that never hit the market — because owners are locked into lower rates, lower prices and lower payments. (Watch me break this down)
I'm in the same boat. If I tried to buy the house I live in today, at today's prices and rates, I don't know if it would work out.
The second problem is that Ohio isn't building. In Clermont County, builders are putting up about three and a half homes for every 1,000 residents right now, based on the U.S. Census Bureau's Building Permits Survey. Back in 1999, it was eight. You can't just flip a switch and turn on home builders. You can see building permits for any county on my Ohio data page. On my national live stream, I compared this across the country, and the difference is staggering. The South is where the building is — and that's a big reason prices are falling in Texas and Florida while Ohio keeps going up.
Can Ohio home prices crash? They absolutely have before. In Centerville, the typical home fell from $322,000 in 2006 to $239,000 in 2012 — down 26%. Batavia dropped about 11%. But crashes need one thing Ohio doesn't have right now: a flood of homes from people who have to sell. Distressed inventory. Job losses. Forced sales. I'm looking for it every week. I'm not seeing it. I explained this in more detail in why the housing market crashed in transactions, not prices, and on my live stream about why high rates haven't crashed Ohio home prices.
That doesn't mean nothing is changing. Demand has fallen in a lot of Ohio markets. In Lakeside, there are about 30 buyers for every 100 homes for sale — down from 130 buyers in 2022. That's a buyer's market. In Batavia, it's still 139 buyers for every 100 homes. Every ZIP code is different, which is why I track where Ohio is shifting toward buyers.
How to Check the Mortgage Payment in Your Ohio ZIP Code
I built a free tool so you can see this for yourself. Here's how:
- Go to jassonfarrier.com/data.
- Click Ohio Housing Data.
- In the menu on the left, under Affordability, click Est. Payment (20% Down).
- Click any ZIP code or county on the map to see its estimated payment — and the chart from 2020 to today.
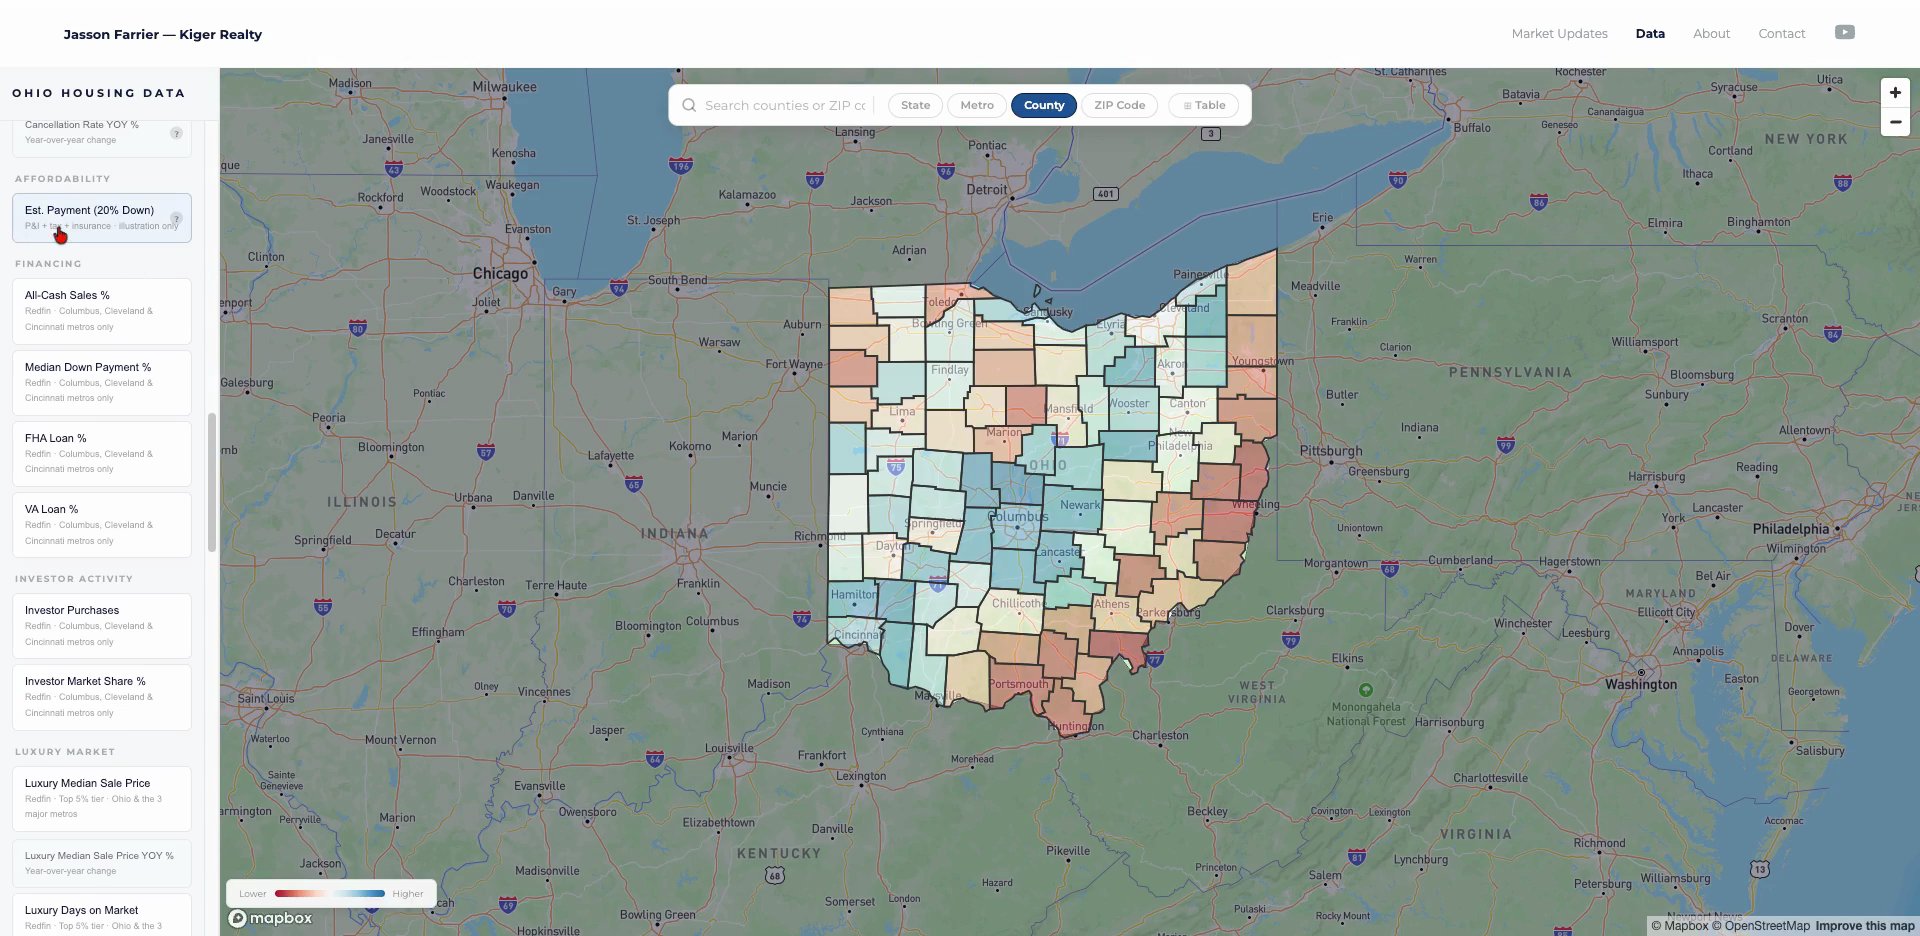
The Ohio housing data map on Est. Payment. Red is more expensive per month. Blue and green are less.
The estimate uses the typical home value in that ZIP code, today's mortgage rate, the local property tax rate, and homeowners insurance based on real premiums paid in Ohio. You can see exactly how I calculate it on the methodology page. If you want to compare Ohio to anywhere else in the country, my national housing data covers every ZIP code in the U.S.
This is a compass, not an exact coordinate. Before you buy, talk to a mortgage professional and get a real quote. (Watch the walkthrough)
What This Means If You're Buying or Selling in Ohio
If you're buying, here's the good news. In a lot of Ohio, you're facing less competition than you have in years. You're probably not going to be up against 20 other buyers like 2021. But don't shop on the price alone. Shop on the full monthly payment — principal, interest, taxes, insurance, and money set aside for repairs. If you're not sure where you stand, my free Buy or Wait guide walks you through it in ten minutes. If you're a first-time buyer, check the Ohio Housing Finance Agency — the state runs down payment assistance and first-time buyer loan programs that can make a real difference on that monthly number. And price cuts are real right now — I covered how to find homes with a price cut.
If you already own, check your property value every year and protest it if it's wrong. Plan for your taxes and insurance to keep climbing. And if you're thinking about selling, price it right from day one. Buyers are stretched thin. An overpriced home in this market just sits.
As a local REALTOR®, I help Ohio buyers and sellers work through exactly these numbers every week. The conversation's free. Reach out anytime.
FAQ
Why did Ohio rank worst for housing affordability?
Ohio lost more affordability than any state from 2020 to 2025, according to the National Housing Conference. The share of Ohio jobs that could afford a typical home fell from 67% to 26%.
Is Ohio still an affordable state to buy a house?
Compared to most of the country, yes. 26% of Ohio jobs can afford a typical home, versus 14% nationally. But Ohio lost its affordability faster than any other state.
How much is the typical mortgage payment in Ohio?
About $1,700 a month for the typical Ohio home with 20% down, including property tax and insurance. In 2020, it was $827. Look up your ZIP code.
How much income do you need to buy a house in Ohio?
It depends on where. In Mansfield, the income needed to buy a typical home went from $28,483 in 2020 to $62,931 in 2025. In Cincinnati, it's now over $100,000.
Are out-of-state buyers driving up Ohio home prices?
They're part of it. Buyers from expensive states see Ohio prices as a bargain and pay up. But low inventory and years of underbuilding are the bigger reasons prices keep rising.
Is the Ohio housing market going to crash?
No sign of it yet. A crash needs a flood of forced sellers. Ohio homeowners are mostly locked into low rates, and new listings are still below 2020 levels.
Will data centers raise home values in Ohio?
Too early to know. Construction booms can push values up in small towns with few homes for sale. I've been tracking Ohio's data center land grab closely.
Sources
- National Housing Conference — Ohio Sees Nation's Steepest Five-Year Decline in Homeownership Affordability
- National Housing Conference — Priced Out: When a Good Job Isn't Enough (full report, PDF)
- Mortgage News Daily — Mortgage Rates
- U.S. Census Bureau American Community Survey — Property Taxes
- Realtor.com Research — New Listings, Pending Ratio
- Freddie Mac — Primary Mortgage Market Survey
- U.S. Census Bureau — Building Permits Survey
- Ohio Department of Taxation — Real Property Tax Data
- Ohio Housing Finance Agency — Homebuyer Programs
- Ohio REALTORS® — Market Data
- Ohio Housing Data — Estimated payment, prices, taxes and permits by county and ZIP
Watch the full breakdown: Ohio's Housing Market Just Got the Worst News in America and the full live stream on Ohio Housing Nerd.
Jasson Farrier is a licensed REALTOR® at Kiger Realty in Granville, Ohio (License #2018004483), and an active real estate investor. He breaks down the Ohio housing market every week on Ohio Housing Nerd, covering all 88 Ohio counties with verified, source-linked data — see the data methodology. Payment figures are estimates for illustration only, not lending advice.